MT5 Indicators
Do you want to use MT5 indicators to boost your forex trading experience? But you don’t know much about it. So read this blog to know all the types pf MetaTrader 5 indicators.
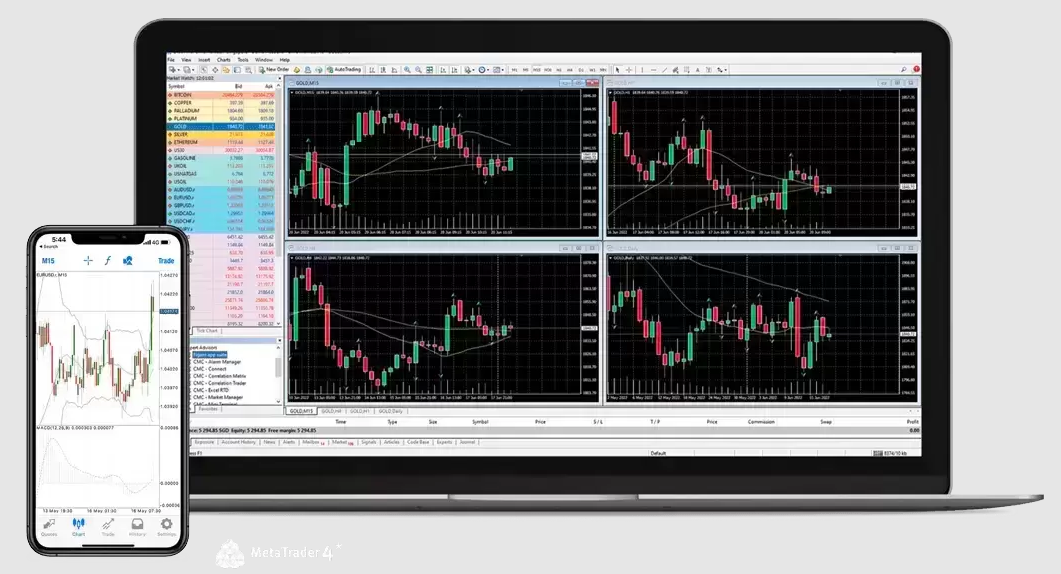
MT5 Platform
MetaTrader 5 is also known as MT5 which is a powerful tool for trading that offers advanced tools for successful trading analysis and trades. It is widely used for forex trading and is also gaining popularity in other financial markets, including crypto, CFDs, stocks, and others. With the MetaTrader 5 platform, a trader can use algorithmic trading tools to program trades, such as trading robots and EA: Expert Advisor.
One of the best forex trading Robots is Majestic EA works on the MT5 platform to automate your trading and make more profit than ever.
What are MT5 Indicators
MetaTrader 5 indicators are designed to help traders of all levels make more informed decisions and improve their trading performance. Signals from technical indicators play an important role in opening and closing deals on stock and forex markets. The core of indicators is a mathematical alteration of a financial symbol price designed to forecast future price fluctuations. Both beginner and professional traders can use the MetaTrader 5 indicators to predict better market behavior and achieve their trading goals.
Types of MT5 Indicators
Keep in mind that Different kinds of indicators work for different purposes. Here are some major types of MetaTrader 5 indicators.
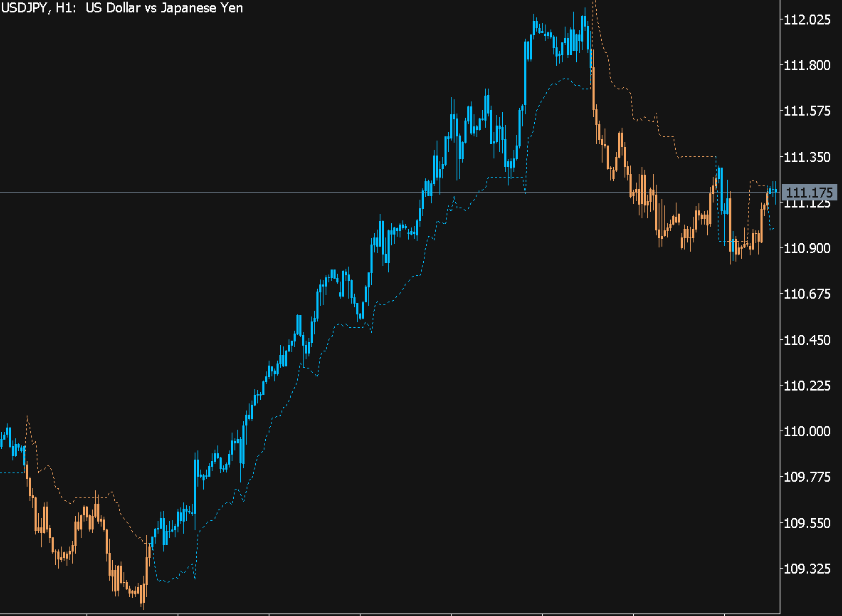
Trend Indicators
The trend indicators are used to identify trends in the financial markets and could help forecast future prices. Here are some different types of trend indicators.
- Standard Deviation – This indicator represents the market instability value of the security. It demonstrates the price movements variations. If its value is high, the market is unstable.
- Moving Average – It indicates the mean price value of the security at a specific time.
- Envelopes – This indicator is designed from 2 moving average indicators, one shifting upward and the other shifting downward. It shows the lower and upper margins of a security price range.
- Bollinger Bands – It showcases the market price volatility of a security over a period. The bands widen when the market is volatile and contract when its value is less volatile.
- ADX: Average Directional Movement Index – The ADX indicator helps in identifying an existing price trend over a period. It eliminates false signals to make sure that only significant price movements are considered.
Oscillators Indicators
This type of indicator represents the price aberration of the security from its usual price value to predict potential trend tracks in the market. Here are the types of oscillator indicators.
- Momentum – This MT5 technical indicator measures the price changes of a security over a certain period. It can be used in confluence with the moving average convergence divergence. The indicator sends a buy signal if it rises, while a sell signal is sent if it reduces.
- Williams %R: Williams Percent Range – If an asset is overbought or oversold this indicator will identify. When it shows a value between 80 percent to 100 percent, it indicates an oversold market. When the values are between 0 percent to 20 percent it shows an overbought market.
- ATR: Average True Range – The indicator shows the market volatility. If you get a higher ATR price, it means a trend setback will be coming soon.
- DeMaker– It compares the maximum price of the existing period with the maximum price of the prior period. When it displays below 30, it sends a strong reversal trend indicator. But when it shows beyond 70, it sends a rude reversal trend indicator.
- CCI: Commodity Channel Index – This indicator measures the commodity amount deviation from its usual price. When the commodity channel price is higher than the average price, it sends a high-price signal, while a low-price signal is directed via contrariwise.
Bill Williams Indicators
Below are the types of technical trading indicators developed by Bill Williams.
- Fractals – It helps to detect the market’s highest and lowest price movements. An upward fractal has 5 bars, where 2 are before and after the highest maximum point of the market. The lowest is shown as the lowest bar in the middle of the 2 higher lows before and after the lowest bar.
- Awesome Oscillators – This indicator measures the market momentum with a 34-period moving average. When the histogram is above zero, it sends a buy signal, but when the histogram is below zero, it sends a sell signal.
- Market Facilitation Index – It shows the change in prices of a security. When it moves in the same direction as the volume, it shows that the price movements have picked up speed. When the two move in opposite directions, it shows that there is confusion between buyers and sellers.
- Gator Oscillator – This MT5 indicator shows the speed of convergence and divergence in the market. The histogram shows that plots the difference between red and green averages. Contracting red bars refers to a slowing trend, while expanding green bars shows that the trend is gaining sellers.
- Williams Alligator – It uses three moving averages of 5, 8, and 13 periods. It identifies unexpected trends via smoothed moving averages.
Volume Indicators
A volume indicator accounts for the volume of the trade, which means the number of trades performed at a specific time or the amount of price movements at a specific time. Here, we have described the types of volume indicators.
- Volume – The volume indicator tells the number of price movements within a period. This indicator contains green and red bars. The green bar shows the current volume being more than the previous one. However, the red bar shows a smaller volume of trade than the previous one.
- OBV: On Balance Volume – It relates volume to the price charge of a security. It indicates a bull market if the security price is greater than the OBV movement. At the same time, A bearish market is suggested if it is lower than the security price.
- MFI: Money Flow Index – It measures the selling and buying pressure of an asset via price volume. Moreover, it also measures the flow of money in and out of an asset over a certain period.
- A/D: Accumulation and Distribution – This MT5 indicator calculated the changes in volume prices of a security. When it increases in price, it sends a buy indicator.