How to Use Technical Analysis for Commodity Trading
Overview of Technical Analysis
Technical analysis is a method used by traders to forecast price movements based on historical data and market statistics. It involves studying price charts, patterns, and various technical indicators to make informed trading decisions. Unlike fundamental analysis, which focuses on company financials and external factors, technical analysis relies solely on price action and trading volume to predict future price movements.
Traders utilize technical analysis to identify trends, support and resistance levels, and potential entry and exit points in the market. By analyzing historical price data, traders aim to predict the direction in which an asset’s price is likely to move in the future. Technical analysis is a widely used tool in the financial markets, as it provides traders with valuable insights into market sentiment and potential price movements.
Understanding Price Charts
Price charts play a crucial role in technical analysis by visually representing the historical price movements of a commodity over a specific period. These charts typically display the open, high, low, and closing prices of a commodity, allowing traders to track its performance and identify patterns or trends. By observing price charts, traders can gain valuable insights into the market dynamics and make informed decisions about their trading strategies.
There are several types of price charts commonly used in commodity trading, including line charts, bar charts, and candlestick charts. Each type offers a unique perspective on price movements and can help traders interpret market behavior differently. Line charts provide a simple depiction of closing prices over time, while bar charts offer more detailed information by illustrating the high, low, and closing prices within a specific period. Candlestick charts are popular among traders for their ability to show price fluctuations and market sentiment through patterns such as doji, hammer, and engulfing candles. By understanding how to read and interpret different types of price charts, traders can enhance their analytical skills and make better trading decisions.
Commodity Recommendation Price charts are essential in technical analysis, displaying historical price movements of commodities. Traders use line, bar, and candlestick charts to track performance, identify patterns, and make informed trading decisions based on market dynamics and trends.
Identifying Trends in Commodity Trading
To identify trends in commodity trading, traders often utilize technical analysis tools such as moving averages and trendlines. A moving average helps smooth out price fluctuations, making it easier to spot the overall direction of the market trend. When the price is above the moving average, it indicates an uptrend, while a price below the moving average signals a downtrend. By analyzing the intersection of different moving averages, traders can gain insight into potential trend reversals.
Another common tool for identifying trends in commodity trading is drawing trendlines on price charts. Trendlines are diagonal lines that connect consecutive highs or lows in a price movement. An upward-sloping trendline indicates an uptrend, while a downward-sloping trendline signals a downtrend. By identifying and validating these trendlines, traders can establish the direction of the trend and make informed trading decisions based on the market momentum.
Utilizing Technical Indicators
Technical indicators play a crucial role in analyzing price movements and identifying potential trading opportunities in the market. These tools are designed to help traders make informed decisions based on historical price data and statistical analysis. By incorporating various technical indicators into their analysis, traders can gain valuable insights into market trends and momentum.
There are a wide range of technical indicators available, each serving a specific purpose in analyzing market behavior. From simple indicators like moving averages and stochastic oscillators to more complex ones such as Bollinger Bands and Relative Strength Index (RSI), each indicator offers unique perspectives on price movements. Traders often use a combination of these indicators to confirm signals and validate their trading decisions, helping them navigate the complexities of the financial markets with greater precision.
Implementing Support and Resistance Levels
Support and resistance levels play a crucial role in technical analysis as they help traders identify key areas where price is likely to either stall or reverse. Support levels represent areas where buying interest is strong enough to prevent the price from falling further, while resistance levels signify zones where selling pressure is significant enough to halt any further upward movement. By plotting these levels on price charts, traders can anticipate potential turning points and make informed trading decisions.
Traders often utilize historical price data to identify support and resistance levels, looking for areas where the price has previously bounced off multiple times. These levels can act as reference points for setting stop-loss orders, determining entry and exit points, and managing risk effectively. By paying attention to how price reacts at these levels, traders can gain insights into market sentiment and increase their probabilities of making profitable trades.
MTF Recommendation Traders use historical data to identify support and resistance levels for making informed trading decisions. These levels help in setting stop-loss orders, determining entry and exit points, and managing risk effectively, ultimately increasing the probability of profitable trades.
Analyzing Volume and Open Interest
Volume and open interest are two key components in analyzing market dynamics and making informed trading decisions. Volume refers to the total number of shares or contracts traded within a specified period, providing insight into the level of market activity. High volume typically signals strong interest from market participants, while low volume may indicate a lack of conviction or participation. Analyzing volume alongside price movements can help confirm the validity of a trend or identify potential reversals in the market.
Open interest, on the other hand, represents the total number of outstanding contracts in a specific market. It reflects the number of positions that have not been closed out by an offsetting trade and can provide valuable information about the liquidity and depth of a particular market. Changes in open interest can indicate shifts in market sentiment or the presence of new players entering or exiting the market. By combining analysis of volume and open interest, traders can gain a more comprehensive understanding of market dynamics and make better-informed trading decisions.
Applying Moving Averages
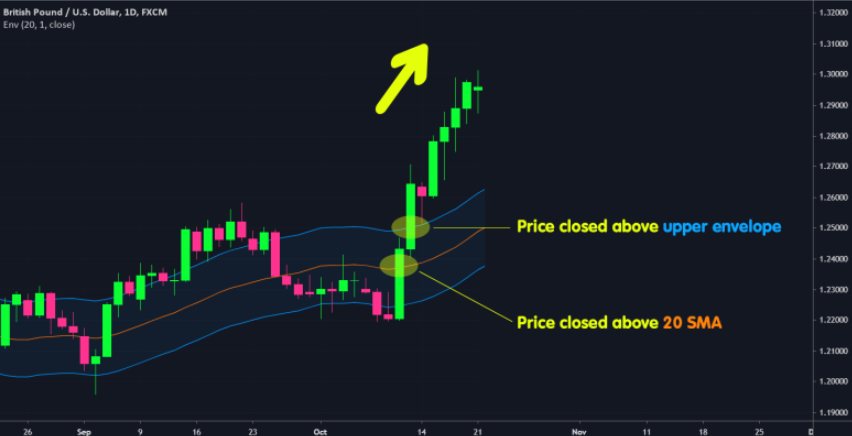
Moving averages are a key technical indicator used by traders to smooth out price data and identify trends over a certain period. By calculating the average price of an asset over a specific timeframe, moving averages help traders to filter out short-term price fluctuations and focus on the broader trend direction. Commonly used moving averages include the simple moving average (SMA) and the exponential moving average (EMA), with each offering a different weighting to recent price data.
Traders often use moving averages to determine potential support and resistance levels as the price of an asset interacts with these moving average lines. When the price moves above a moving average, it may act as a support level, indicating a potential buying opportunity. Conversely, if the price drops below a moving average, it could signal a resistance level, suggesting a possible selling opportunity. By analyzing the relationship between price and moving averages, traders can gain valuable insights into market trends and make informed trading decisions.
Utilizing Fibonacci Retracement Levels
When utilizing Fibonacci retracement levels in technical analysis, traders look to identify potential areas of support or resistance in a market. These levels are based on key Fibonacci ratios such as 23.6%, 38.2%, 50%, 61.8%, and 100%, which are drawn on a price chart to indicate possible reversal zones. Traders use these levels to anticipate where a price pullback may occur or where a trend could potentially reverse, helping them make informed trading decisions.
Fibonacci retracement levels are particularly useful in conjunction with other technical indicators and analysis tools to confirm trading signals. By combining Fibonacci retracement levels with other technical analysis methods, traders can increase the probability of successful trades by validating potential entry and exit points. Additionally, Fibonacci retracement levels can be applied to different timeframes, allowing traders to adjust their trading strategies based on the market conditions they are analyzing.
Scalping involves making quick trades to profit from small price movements. Combining Fibonacci retracement levels with other technical indicators can enhance trading signals and improve the accuracy of entry and exit points, increasing the likelihood of successful trades.
Identifying Chart Patterns
Chart patterns are key tools for traders using technical analysis to forecast future price movements of commodities. These patterns are formed by price movements on a chart and can provide valuable insights into potential market trends. By recognizing and interpreting these patterns, traders can make informed decisions on when to enter or exit trades.
Common chart patterns include head and shoulders, double tops and bottoms, triangles, flags, and pennants. Each pattern has its own unique characteristics and implications for price movements. Traders should pay close attention to how these patterns develop over time and consider additional indicators to confirm potential trading signals.
margin trading app allows traders to identify chart patterns, crucial for forecasting price movements. These patterns, such as head and shoulders, double tops and bottoms, triangles, flags, and pennants, offer valuable insights for informed trading decisions.
Developing a Trading Strategy with Technical Analysis
When it comes to developing a trading strategy using technical analysis, traders often rely on a combination of tools and techniques to make informed decisions. By analyzing price charts, identifying trends, and utilizing technical indicators, traders can gain valuable insights into the market behavior. These insights can help traders make more precise entry and exit points, effectively managing risk and maximizing potential profits.
Another crucial aspect of developing a trading strategy with technical analysis is the application of support and resistance levels. These levels act as significant price points where the market tends to react. By understanding these levels, traders can anticipate potential price movements and adjust their strategies accordingly. Additionally, analyzing volume and open interest can provide further confirmation of market trends, helping traders make well-informed trading decisions based on market sentiment and participation.